Insights
Palm oil mill in Ghana keeps an eye on zero-deforestation commitments
Romain Pirard, Senior climate expert / Forland coordinator (romain.pirard@onfinternational.org)
FORLAND is venturing into the field of zero-deforestation commitments
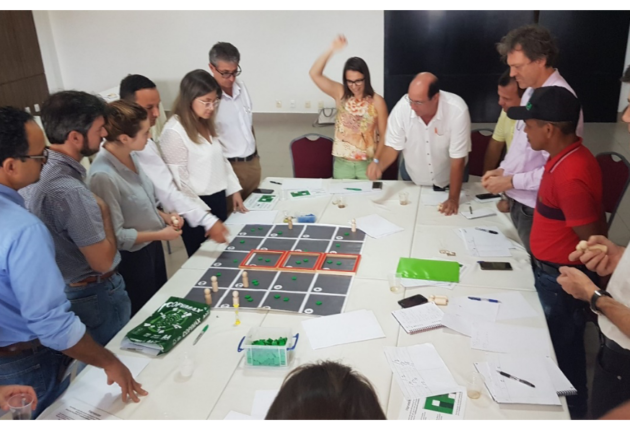
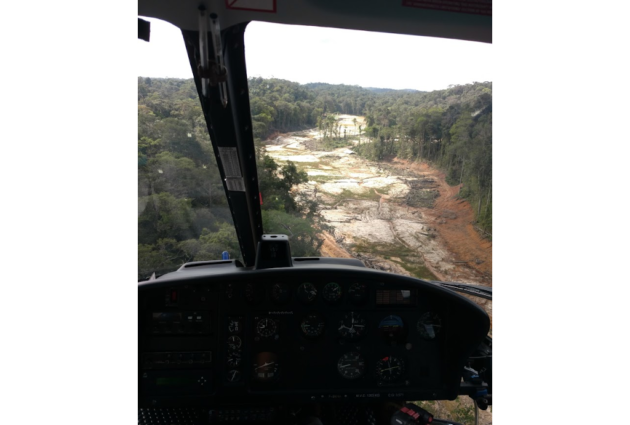
FORLAND, our decision-support tool for landscape management, has been applied in various contexts and in different ways. One key characteristic of these applications has been to frame and stimulate participatory processes through site-specific interactions using tools such as board games in combination with various functions integrated into the digital platform (e.g., participatory mapping translated into digital maps or visualisation of scenarios). For instance, an ongoing experiment is taking place in northern Cameroon in which FORLAND is being adapted to help with landscape planning (in the “communes” as sub-national administrative levels) – and, by so doing, agree on – the future of their landscapes. We have also been active in remote sensing applications to monitor the evolution of forests; for example, in Guyana FORLAND was used to help the local forest agency detect illegal gold mining activities in real time.
« Here we describe a different application of FORLAND […] to help a palm oil mill ensure that its suppliers are not involved in deforestation »
Here we describe a different application of FORLAND, this time in Ghana, where it is being used to help a palm oil mill ensure that its suppliers are not involved in deforestation. Because this mill has signed up to a zero-deforestation commitment and aims to eventually gain RSPO certification, it needed a tool that is both reliable and easy to use for on-the-ground monitoring.
Important characteristics of this case
A few contextual details are relevant to understanding this application of FORLAND:
- The palm oil mill relies almost exclusively on smallholders for its supplies of Fresh Fruit Bunches (FFB) and is engaged in an ambitious process to be fully reliant on “loyal” suppliers that do not sell their FFBs to other mills in the area.
- The suppliers are scattered over seven separate zones or supply sheds, where the remaining forest patches are of various sizes and in different conditions, from large blocks of dense forest to open forest areas in transition zones.
- All activities were completed remotely, as the pandemic prevented our experts from travelling to the region.
- The final product needed to be easy to use so that the company could monitor the situation on the ground in near-real time (i.e. with weekly updates) and take corresponding action whenever necessary.
The tasks included: (i) the creation of a baseline map (Figure 1) that describes the land use / land cover in the supply sheds according to layers such as forests, oil palm plantations, wetlands or water streams; (ii) the integration of the forest monitoring tool and associated alerts to the FORLAND digital platform; and (iii) the development of a monitoring plan with relevant indicators displayed on user-friendly dashboards.
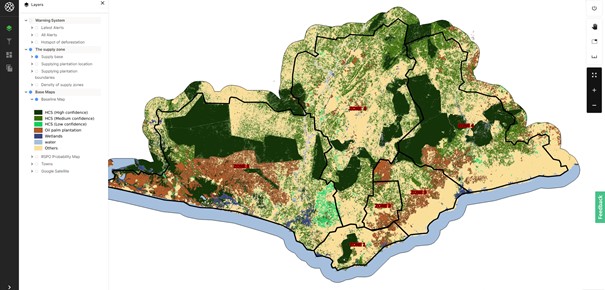
Figure 1. Baseline map
An original approach to the identification of areas of interest (forests in “good condition”)
One strategic decision was to choose the most appropriate method to identify and map “areas of interest” where forests that were in sufficiently good condition should be left out of the supply chain. This point is strategic because companies with voluntary zero-deforestation commitments can chose their own criteria. Yet because in this case the ultimate objective is to get RSPO-certified, we chose the High Carbon Stock Approach (HCSA). To overcome our inability to conduct inventories and field observations in person to identify HCS forests, we developed an approach to make the most accurate and relevant identifications using available secondary information.
« How did we identify areas of interest [without field observations due to the sanitary crisis]? We used two main pieces of information: vegetation and biomass stocks »
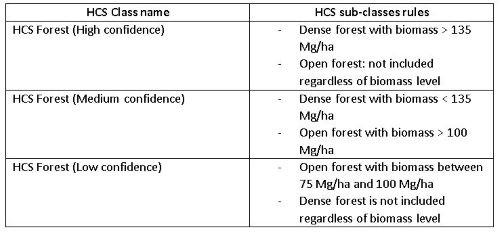
How did we identify areas of interest? We used two main pieces of information: vegetation and biomass stocks. First, Sentinel 1 data were translated into forest and non-forest areas, without any further information about the type and condition of these ecosystems. This also enabled us to distinguish sizeable blocks of dense forests from areas of open forest where there is a mosaic of land uses. Second, we cross-checked this map with another dataset that provides estimates of biomass stocks. Based on the following rule (Table 1), we were able to classify HCS forests and/or areas of interest based on the degree of confidence.
Table 1. Classes of High Carbon Stock (HCS) forest, based on confidence
Alerts and the visualisation of ongoing processes on the ground
« We needed to find the right balance with the company […] between false alerts […] and missed deforestation events »
Once the baseline map was finalised and the monitoring tool was providing weekly updates, an alert system was put in place to convey information about areas with suspected deforestation. The risk of false alerts is compounded by the fact that a significant proportion of the area comprises open forests and a mosaic of land uses where forest disturbances routinely take place.Thus we needed to find the right balance with the company (as the final user of the system) between false alerts (i.e., too much “noise” and lack of clear guidance for action in the field) and missed deforestation events (i.e., violations of the zero-deforestation commitments by suppliers going undetected).
Assuming that this trade-off finds a satisfactory solution for the user considering their own needs and constraints, the visualisation of alerts posed yet another challenge. Our aim is to make the system as easy to manipulate and as user-friendly as possible. To do so, we designed maps with hotspots of deforestation (Figure 2) that are automatically generated after each update and that flag areas where most alerts seem to be located (based on both the number of forest disturbance patches and their surfaces). Note that these hotspots of deforestation are estimated in relative terms (i.e., if the user zooms in, hotspots are recalculated for the new area of focus). This flexibility enables the user to explore the region and easily find those areas where deforestation is likely occurring.
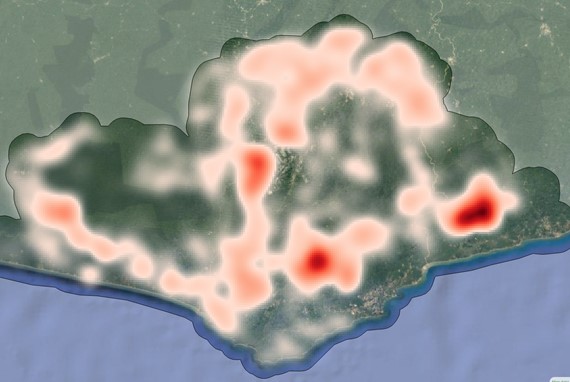
Figure 2. Hotspots of deforestation
Dashboards and filters are key to making the best use of the forest monitoring tool
« Raw data and information are good, but even better is to present information in such a way that the company can use them to take action. This optimal use must rely on bespoke filters and dashboards that organise the information based on needs »
Raw data and information are good, but even better is to present information in such a way that the company can use them to take action. This optimal use must rely on bespoke filters and dashboards that organise the information based on needs. As the area has rapidly evolving land uses and a dominance of open forests, which in turn means a high number of alerts (real or false), we started with filters to sort these many alerts. We provided several filters that enable the user to focus on the alerts that are deemed of higher risk and importance for action. Three of the main filters are:
- HCS forest class. Because we proceeded with three different classes of HCS forest based on confidence, and since most alerts concern the third class that is less likely to qualify as HCS forest based on field observations, it makes sense to let the user choose only one or two of the classes with the highest confidence if they lack the human resources to ground-truth the results.
- Distance to suppliers’ plantations. The monitoring system covers an entire region, but suppliers are scattered throughout and with different intensities. Therefore, it makes sense to provide an option to focus on alerts that are at a short distance from suppliers, hence with a higher probability that they represent clear-cuts for the establishment of oil palm plantations to supply FFBs to the mill.
- Surface. Preliminary results suggest that very small plots are deforested at once (within one-week periods in between satellite updates) with less than 1 ha or even 0.5 ha. Based on discussions with the user, it may be relevant to focus on areas where greater surfaces of deforestation are detected, for at least two reasons: the probability that the alert is accurate, and the probability that it relates to deforestation rather than degradation, are both higher.
Because filters can be combined and are applicable to the baseline map, alerts and hotspots of deforestation, respectively, they offer the user several options for tailoring the monitoring to their specific needs and preferences.
The visualisation of results is also improved with dashboards that serve to present the information in the most meaningful way for the user. Specifically, we thought of indicators that provide more distance and depth to the user and that offer an improved understanding of the situation and its evolution. An obvious first approach is to look at the cumulative area of forest disturbance, as well as the aggregated area per period (e.g., day, month or longer period). These results might show a pattern with seasonality in deforestation, usually due to the succession of dry and rainy seasons (Figure 3).
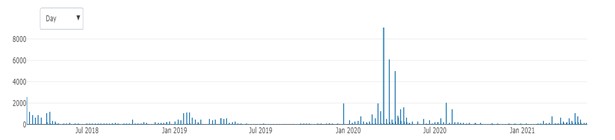
Figure 3. Aggregated forest disturbance area per period (ha)
Other options coincide with the filters (see above) and similar graphs are produced to present the information based on distance to suppliers’ plantations, patch size for alerts, or combinations of these variables. Figure 4 shows that forest disturbances detected though weekly updates are small areas. Arguably, an improvement would be to process this information and find out whether adjacent patches are detected from period to period, thus indicating a larger deforestation process linked to plantation development by one of the mill’s suppliers.
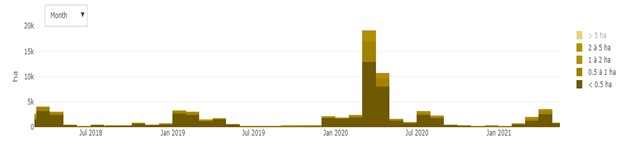
Figure 4. Aggregated forest disturbance area by patch size and per period (ha)
Lessons learned from this new application of FORLAND
This experience was rich in terms of lessons, and the FORLAND team was excited to venture into these new waters. It provided us with an excellent opportunity to test our ability to deliver an application of the tool that serves a concrete purpose: enabling a private client to improve its supply chains and embark on the road to sustainability and RSPO certification.
One major lesson was that the methods to identify areas of interest are complex and evolving, usually requiring field inventories and discussions with stakeholders to verify and complete satellite-based information. But when dealing with obstacles to such first-hand analysis – and particularly at a time when travel was limited by the pandemic – we realised that creativity makes up for these limitations, at least to some extent. Ground-truthing can be organised remotely by communicating sample points to the user (who has direct access to the plots), and our system to classify HCS forests based on their probability of being deforested appears to be a sound approach to guide action in a first phase and with a limited budget.
Another interesting lesson lies with the absolute need to provide the right indicators and visualisation tools that add value to the raw data and alerts; otherwise, there is a risk that users struggle to interpret the flow of information. One must understand that a single alert conveys limited meaning; it needs contextual details, such as its proximity to suppliers or its size, for a more complete picture to emerge. As such, indicators and visualisation tools must be designed in collaboration with the end user in order to truly meet their expectations.
A third lesson relates to the essential finding that alerts are necessarily flawed to some extent, and the right balance must be struck between false alerts and omissions depending on the user’s priorities. For instance, one client might be eager to ensure that no deforestation goes undetected, whereas another may have limited staff resources and prefer to avoid the distraction of too many alerts.
« This rich experience has equipped the FORLAND team with new proven skills in the field of zero-deforestation commitments and deforestation-free supply chains »
All in all, this rich experience has equipped the FORLAND team with new proven skills in the field of zero-deforestation commitments and deforestation-free supply chains – skills that we look forward to applying in other contexts and with new clients.